


The Facts
Semafor Intelligence, a new AI-enabled editorial insight product built on our global convenings, began as a prototype that Semafor Tech Editor Reed Albergotti made using OpenAI’s Codex the Sunday morning after Semafor World Economy 2026 wrapped up, with the goal of identifying the central themes across conversations over five days on three simultaneous stages. After he shared it with the newsroom, Alastair Clements, Semafor’s data lead, worked with Reed over the next 36 hours to turn the prototype into a robust analytical tool that parsed 4,900 distinct claims from more than 300 speakers, every claim anchored to a specific quote in the transcripts.
The tool analyzed every transcript, pulled out every distinct claim each speaker made, and turned each one into a numerical fingerprint that captures meaning rather than wording. This technology is called “embedding” or “vectorizing” and is becoming a common way to process large amounts of text to understand the relationships between the ideas in a corpus: It essentially assigns ideas to a complex string of numbers, then uses those numbers to understand the semantic proximity between ideas. This proximity map was used to help refine the report. The tool then used multi-agent reasoning to surface direct quotes from speakers that support or push back on the central themes.
Semafor’s journalists then reviewed every theme: stress-testing the premises, interrogating the supporting quotes, and editing down to the ones most clearly supported by what was actually said. The report is a product of that editorial process. Current AI systems aren’t capable of generating insights on their own more reliably than journalists, but they can allow us to build tools that expand the scope of what journalists can discover and analyze. The technology determined what was possible to surface; the journalists determined the framing and what was worth publishing.
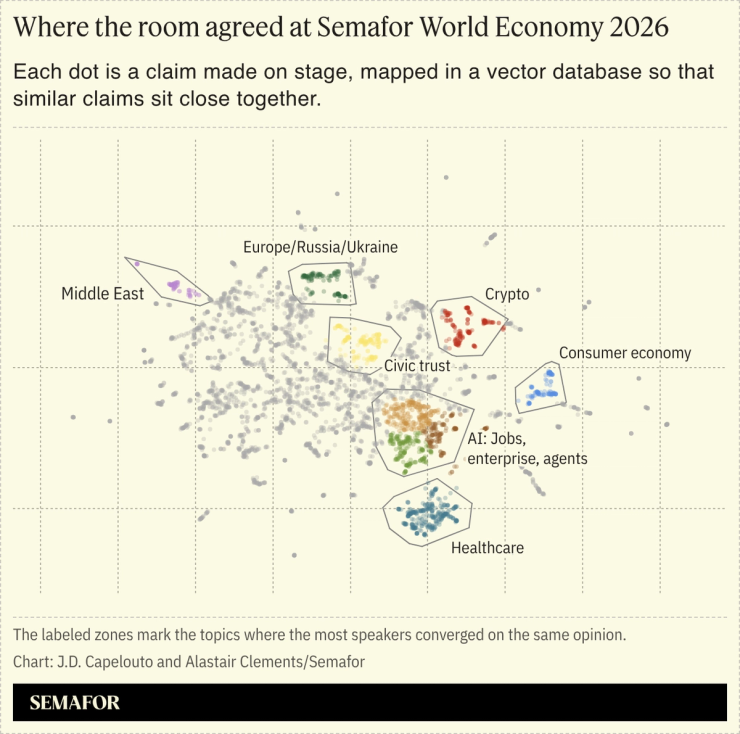
For the technically curious: The vector database runs on Google’s BigQuery. The fingerprints themselves were produced by an embedding model from an AI company called Voyage (now owned by MongoDB). Anthropic’s Haiku 4.5 and Opus 4.7 models helped with text analysis. A second-pass ranker from Cohere helped the system surface the relevant evidence for each query. The cluster map you see above came out of an open-source library called UMAP that compressed our 1024-dimension vectors into two-dimensional coordinates. The whole pipeline was wired together using Claude Code. In all, the API calls and new database only cost a few hundred dollars.
In this article:
Alastair’s view
The most interesting thing about this project is not the technology we built, but the fact that Reed and I built it in a matter of days. Four years ago, an analysis like this would have required a data science team, weeks of scoping and implementation, and a six-figure budget; now, it takes a journalist with limited engineering background and a data lead with one foot in editorial. We needed some knowledge of vector databases, embedding, and development, but we were still able to go from prototype to a viable product in less than two days.
This workflow is becoming more common in applied AI: A domain expert codes a rough prototype with agentic coding tools to prove out an idea, then someone with technical expertise closes the gap between prototype and product. As AI tools get cheaper and more capable, there’s no reason to expect that process to slow down. Our tool runs on commodity infrastructure that any team with a credit card can spin up. The scarcer input, increasingly, is having the imagination to know what to build with it.
As for the output: The tool surfaces patterns across thousands of claims that no journalist could hold in their head simultaneously, anchoring every theme to a verbatim moment on stage. That’s only possible because of the corpus of transcripts that sits underneath it. As scrapers and agentic research agents slurp up open content across the internet, proprietary information and data become scarcer and more valuable. Any organization sitting on a comparable trove can embed and query it on the same toolchain we used here. Most of them don’t yet realize they can.
Gina’s view
The tool doesn’t just help our journalists work more efficiently and effectively; it extends and expands what we can do. It currently works on a set of transcripts of panels held over the course of a week, but there’s no reason to restrict it to panel discussions: we could load in analysts’ reports, CEO speeches, podcast transcripts and the like — including any proprietary data and notes we have.
We don’t have a monopoly on this, of course; anyone can build this tool and do the same analysis. Ultimately it comes down both to what information you have that isn’t public, and the quality of the questions you ask the system to track — skills that humans have that machines don’t. Yet.
Room for Disagreement
The system only captured what was said on stage, so it missed behind-the-scenes conversations, or discussions held during Semafor World Economy under Chatham House rule. Semafor’s journalists helped fill in the gaps by augmenting the readout with reporting that wasn’t captured in the transcript.
The organizing categories the model used to group claims are also biased toward the topics it has the most training data on, which can sometimes focus on AI and US-centric framings.
This kind of analysis also raises questions about public discourse more broadly. When everything said on stage, on a podcast, or in an earnings call can be systematically indexed and analyzed for consistency, contradiction, and consensus, the nature of public statements tends to change. Often influential speakers become more considered in what they say, or simply more guarded.